| |
  |
|
|
Second Of
A Series By Karen
Walz
Introduction
Tools For Comparison When someone is asked about the place she lives, the answer often relates to "quality of life." Since this term can mean many different things, it is difficult to make comparisons from one person to another or from one community to another. This evaluation uses both qualitative and quantitative sources to gain some insights into the character of today's major cities. Quantitative assessments are based, for the most part, on information collected by the U.S. Census Bureau or the U.S. Bureau of Economic Analysis. Unless otherwise noted, this information relates to the urbanized areas centered on these major cities (for most of these issues, data is not available for a single city). Qualitative assessments are based on the city-by-city comparisons made in the 2000 edition of the Places Rated Almanac. While the Almanac's weighting of individual factors and its overall city scores are clearly open to varying interpretations, its background analysis offers an assessment of individual factors that is comparable from one metropolitan area to another. Living in America's "Postwar Cities"
This series examines the characteristics of the 16 major U.S. cities listed in the box to the right, as well as the challenges they face and the actions they have taken to meet these challenges. Termed the "postwar cities," these are the largest cities in the United States that have added more than half their population since 1940. The initial article in this series proposed several reasons why these are the cities to watch:
Other major cities also impact large metropolitan areas and are home to businesses and residents who have chosen the quality of life they offer. While the postwar cities share some characteristics with older major cities, they also have notable differences. In this article, the 30 largest cities in the United States (those with the most population in 1998) are examined to identify similarities and differences, and to then determine what challenges must be addressed by the successful livable communities of the 21st century. The older major cities (those with more than half the size of their current population before 1940) are: Baltimore, Boston, Chicago, Cleveland, Denver, Detroit, Indianapolis, Milwaukee, New York City, Philadelphia, Portland, San Francisco, Seattle and Washington DC. Growth Trends Tell Part of the Story Major cities and the urbanized areas that surround them are popular places to live. In 1998, 12.7 percent of the U.S. population lived in one of the 30 largest cities. The fourteen older (pre-World War II) major cities were home to 18.4 million residents, while the sixteen postwar major cities had 16.0 million residents. The population of the postwar cities has increased dramatically since 1990, with an average increase of 10.2 percent (compared to a 2.4 percent average decrease in the population of the older major cities). These population trends are expected to continue into this new century. Job growth is a second important aspect of cities' growth and desirability. In 2000, the Places Rated Almanac included projections for job growth through 2005. For older major cities and their metropolitan areas, jobs are projected to grow an average of 5.1 percent. In the postwar major cities and their metropolitan areas, jobs are projected to grow an average of 7.7 percent. These differing growth rates mean that the postwar cities will capture an increasing share of the 21st century's employment. Their competitive advantages can offer insights for other cities, as can their strategies to attract and accommodate growth. Home Sweet Home What attracts people to these communities? What keeps them living there? The overall rankings presented in the Places Rated Almanac show that all but two of the 30 major cities and their urbanized areas ranked in the top 75 of the 354 urban areas studied in 2000 (only Detroit and El Paso ranked below 75th place). These communities' mean scores on the 9 factors considered by the study were quite similar -- 68.2 on average for postwar major cities, 70.0 on average for older major cities, where the top-ranked community scored 75.57 and the lowest ranking was 20.36. All major cities enjoy similar strengths in the transportation category. Compared to smaller urban areas, all these cities tend to have more extensive public transportation systems, better access to rail and air facilities and good connections to other major destinations. On other factors, however, they are quite different. The older cities are strongest in terms of education, crime, arts, health care and recreation. The postwar cities are stronger in terms of cost of living, jobs and climate. These differences are detailed below. They suggest that the people and businesses that are attracted to postwar major cities are choosing a different set of assets than those who choose the older major cities. Go Where the Money Is? One attraction of the postwar
cities is a lower cost of living. According to Places Rated Almanac's
evaluation of factors affecting cost of living, the average cost of living
score for postwar cities was 51.4 (on a scale where 100 is the best and
0 the worst); the average score for older cities was 14.1. Of the 30 largest
cities, nine of the top ten for best cost of living are postwar cities.
The high cost of living in California is reflected in these comparisons;
all the majorCalifornia cities scored poorly on this indicator, along
with New York, Boston and Washington DC.
The lower cost of living is balanced by a lower average income in the postwar cities. The Bureau of Economic Analysis calculated per capita personal income for 1998 for all U.S. metropolitan areas and compared it to per capita personal income in 1969. All major cities reported higher per capita personal income than the U.S. average of $27,203. For the postwar cities, the average per capita income in 1998 was $28,633; for older major cities, it was $33,218. Only two of the 16 postwar cities ranked in the top 10 for per capita income (San Jose and Dallas). However, postwar cities led the way in increasing per capita income. Of the 30 major metropolitan areas, the five reporting the largest percentage increase in per capita income were all postwar communities (Austin, Charlotte, Memphis, Nashville and San Jose). Local government's revenues and expenditures are also related to the patterns of personal income and cost of living noted above. The U.S. Census Bureau's reporting for 23 of these 30 major cities shows that, in 1994, the older major cities had much higher revenue levels, both in general and from their own revenue sources. Washington DC, New York, San Francisco and Boston all reported general revenues above $3,000 per capita. The postwar city with the highest per capita general revenue was Memphis at $1,630; most postwar cities reported general revenues below $1,200 per capita. The trends for revenue from the local government's own sources are similar. Only 4 of the 12 older major cities reported revenue from own sources under $1,000 per capita. For postwar cities, only 2 of 11 were above that level (Dallas and Jacksonville). While there are many factors that affect local governmental revenue, the relative levels of revenue in older and postwar cities suggest that the newer cities have fewer resources available to provide public services and facilities. Conversely, they suggest that residents of postwar cities keep a greater share of their income to spend for goods and services they select themselves. 21st Century Options for Living What are the differences between the people and homes in older and postwar major cities? Census data for urbanized areas in 1990 shows some interesting similarities, as well as notable differences.
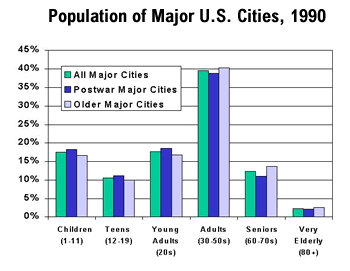
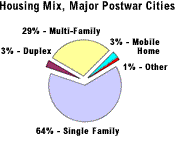
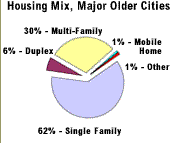
The people in the postwar major cities tend to be younger than in the older major cities. The bar chart above shows that a higher percentage of the population in postwar cities (on average) were children, teens or young adults in 1990. The older major cities' populations included higher percentages of adults (from 30 to 59 years of age), seniors (from 60 to 79 years of age) and the very old (80 years and older). The rate of homeownership is approximately the same for all 30 major metropolitan areas (an average of 62.5 percent). Postwar cities had a slightly lower homeownership rate in 1990 than did older cities (61.3 percent for postwar cities, compared to 63.7 percent for older cities). In 1990, single family homes dominated the available housing options in all major cities, as shown in the Housing Mix pie charts below.
A closer look at this data identifies interesting differences between the older and postwar major cities and their metropolitan areas. While both had approximately 62 percent single family units in 1990, the single family homes available in postwar cities were more likely to be detached units. Detached single family homes accounted for 58.2 percent of the housing in postwar cities, with attached single family homes and duplexes comprising only 8.7 percent of housing. In older major cities, single family detached homes were 50.3 percent of the units, while attached single family homes and duplexes accounted for 16.9 percent of the housing units. This characteristic of housing type is also supported by data on the density of cities. Postwar cities tend to be less dense than the older major cities. On average, the density of a major postwar city is 2,683 persons per square mile, while the average density for older major cities is 9,236 persons per square mile. Getting Around Town Transportation and congestion are often cited as important factors in evaluating cities. Both the 1990 U.S. Census and the 2000 Places Rated Almanac give postwar cities the edge when it comes to travel times. According to the Census, the average journey to work for postwar cities took 21.9 minutes, while it took 25.1 minutes for older cities. On the other hand, older cities have a much larger investment in public transit (an average of 2,510 route miles, compared to 1,584 route miles average for postwar cities). Culture and Leisure The major cities that "came
of age" before World War II are home to many world-class colleges,
universities, libraries, museums and symphonies. These investments, many
of which began before 1900, are reflected in the higher scores these cities
received from the Places Rated Almanac for education,
The same pattern holds true for health care, with postwar cities scoring lower on average than the older major cities. Nashville is the only postwar city to rank in the top 10 of the 30 major cities on this measure. Per capita spending on hospitals and health care is also notably lower in the postwar major cities. Challenges Facing Postwar Major Cities Major cities and their metropolitan areas are attractive places to live and work. This analysis suggests that the features that attract people to the older major cities are different than those that are appealing about the newer, postwar major cities. What do these differences mean for the postwar cities (and the even younger cities growing around them) as they face the 21st century? What are the challenges to be addressed if these cities are to be livable and sustainable over time? Eight questions summarize the issues.
Next In Livable Cities of the 21st Century The actions taken by public and private sector leaders and organizations in today's major post war cities suggest potential approaches to the issues described above. This exploration of 21st century cities will continue with an evaluation of those results and a set of recommendations for other communities. It will also examine the results of neighborhood-oriented programs and initiatives that major postwar cities are using to address these challenges. Karen
S. Walz is the Principal in Strategic Community Solutions (SCS)
and the Executive Director of The Dallas Plan, a non-profit organization
created to work with the city of Dallas and the Dallas community to
create and implement a long range plan. Prior to forming SCS, Walz was
Director of Planning for Freilich, Leitner and Carlisle, managing planning
projects for clients nationwide. She has also served as the Manager
of Comprehensive Planning for the City of Austin and as Special Assistant
for Economic Policy at the Boston Redevelopment Authority. |
|||||||||
|
Home | History & Archive | Video Productions & Services © Copyright 1998-2023 EcoIQ
|


 hat
makes a livable city? What lessons can be learned from today's cities
so the cities of the future are both livable and sustainable? In this
article, the examination of major postwar cities in the United States
continues with an assessment of the characteristics that define these
cities and distinguish them from older major cities. The unique features
of the postwar cities determine the challenges they face, the set of
tools they can use to address these issues and the specifics of programs
that will be successful. A comparison of the two groups of cities offers
insights into the meaning of "quality of life" in the 21st
century and the strategies that may help achieve it.


